 (888) 815-0802
Here’s Your Definitive List of Sales Metrics and KPIs for 2024: Part One
The ability to track sales metrics and KPIs is the closest thing that sales leaders get to having a crystal ball. The right metrics can instantly reveal which reps are most active, which are most efficient and which need additional coaching in order to hit goals. But beyond merely revealing insight into reps’ performance, tracking the right sales KPIs is critical to assessing they overall health of your sales pipeline. After all, if your sales process isn’t moving the needle fast enough, it’s important to figure this out long before QBRs.
In the current sales climate, more companies are migrating to a remote sales model. And a lot of companies are finding it harder to build pipeline than ever before. Because of these factors, it has only grown that much more important to track the right sales metrics and KPIs.
To help you succeed during this tough sales climate, we’ve put together a four part series that shares a list of some of the most important sales metrics that all sales leaders should be tracking. And while no single list of sales metrics can ever be considered “complete”, this list we’ve assembled should give you a good idea of how some of the most successful sales teams are tracking performance in real time.
By the way, if you want even more sales metrics, including top metric picks from some of the world’s foremost sales experts, I highly recommend downloading our Complete Guide to Inside Sales Analytics.
Fortunately, advances in sales technology have made it easier than ever for sales leaders to take on the role of data scientists. It has never been easier to quickly gain a deep understanding of exactly what it will take to help reps hit their goals. Revenue.io offers powerful Salesforce dashboards right out of the box that makes tracking many of the following metrics turnkey.
But whether you decide to use Revenue.io or not, now is the time to take a look at the sales KPIs that you’re tracking. And ask the ever-important question: am I tracking the data I need to coach my team to success?
Outbound Sales Metrics and KPIs
Do you have sales development reps (SDRs) who are partially or completely focused on outbound prospecting? If so, it’s essential to make sure you are tracking the right KPIs. The most successful sales managers are consistently tracking how busy reps are (in terms of dials, emails and other outbound touch points). But it’s also essential to track which reps are most efficient. As an example, there may be reps who spend less time on calls but are more efficient at booking meetings and moving deals forward. If you’re looking to gain insight into the core health of your outbound sales team, the following metrics are a fantastic place to start.
By the way, Revenue.io delivers a slew of outbound sales metrics right out of the box.
Dials Per Day
Key Question it Answers: How productive are reps at dialing prospects?
What it Measures: The total number of attempts a rep makes to call prospects in a given day
Value: Many sales organizations have a dialing quota since more dials can equate with more meaningful sales conversations and revenue.
Emails Per Day
Key Question it Answers: How productive are reps at emailing prospects?
What it Measures: The total number of sales emails that individual reps send out each day
Value: It’s important for reps to keep up a regular cadence of calls and emails with prospects.
Conversations Per Day
Key Question it Answers: How efficient are your reps at connecting with prospects?
What it Measures: The number of times reps have actual conversations with leads each day.
Value: More conversations each day virtually always correlates with higher quota attainment. While it’s true that reps can’t completely control the amount of conversations they have each day, with dialing technology they can maximize their chance of connecting with sales-ready leads.
Average Outbound Call Duration
Key Question it Answers: How effective are your reps during those phone calls?
What it Measures: The average length of time that connected outbound calls last.
Value: A close cousin to the “conversations per day” metric, reps that can’t keep prospects on the phone for longer than two minutes should be subject to further scrutiny by managers.
Average Call Disposition
Key Question it Answers: What are the outcomes of outbound calls?
What it Measures: The outcomes of your sales team’s calls in aggregate.
Value: Call disposition is a term that stems from call centers referring to the outcome of a call. Some common call dispositions might include busy, no answer, hang-up or appointment set. By tracking these call outcomes in your CRM, you can view a report that gives a bird’s-eye-view of a rep’s call outcomes. This can be valuable because if there is a disproportionate amount of certain call outcomes it can signal a red flag. As an example, if Marketing is providing Sales with a high number of disconnected numbers, then it could mean that there’s a problem with the lead source.
Voicemail Return Rate
Key Question it Answers: How successful are reps at getting leads to return voicemails?
What it Measures: The percentage of callbacks from voicemails
Value: Getting prospects to return voicemails can be one of the most difficult tasks in outbound sales. Looking at a voicemail return rate can help you identify which reps are leaving the most successful voicemails and which reps need additional coaching. You can also check to see whether coaching initiatives improve reps’ voicemail return rates.
Outbound Call Volume Vs. Total Goals
Key Question it Answers: Are reps dialing as many leads as they are supposed to?
What it Measures: The number of outbound dials a rep makes each day in relationship to their call goal.
Value: Since more dials can result in more conversations, it’s important to ensure reps are making enough dials each day. One way to do this is to establish how many dials a rep should make (e.g. 50 per day) and then track actual dials against this benchmark.
Contact Attempts per Account
Key Question it Answers: How many times are your reps reaching out to contacts at a particular company?
What it Measures: The total number of times any person at a particular account is contacted by phone or email by a rep on your team.
Value: It’s important to have an overhead view of which reps are reaching out to each account, as well as how often. Even in small sales organizations, it’s common for different reps to reach out to the same account without knowing it. Managers should ensure that accounts aren’t being hit by multiple reps. It’s also important to ensure that accounts aren’t being contacted too frequently or not frequently enough.
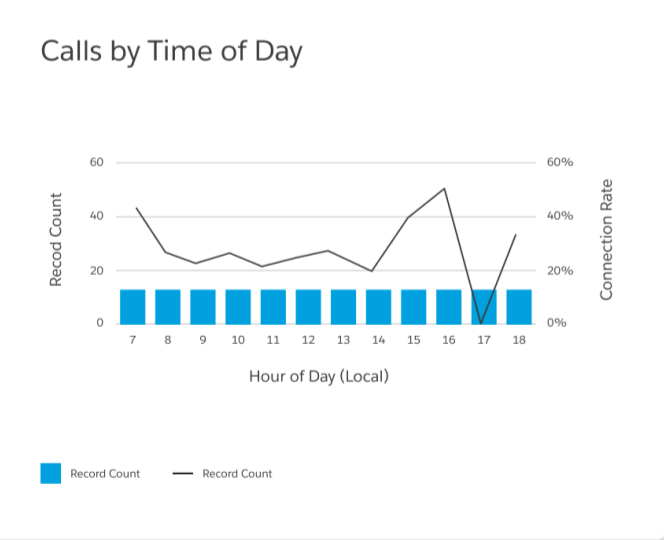 Outbound Calls by Time of Day
Key Question it Answers: Are reps calling at optimal times of day?
What it Measures: The total number of outbound calls an individual rep makes by time period.
Value: Viewing outbound calling activity by time of day gives managers insight into individual reps’ workflow. You might find that top performing reps are doing the brunt of their calling during specific key call windows (as an example, decision makers tend to be easier to get ahold of in the early morning and late afternoon). More successful reps might be more strategic about when they dial prospects. If a rep is doing a lot of calling at inopportune times (e.g. during lunch hour) they can be trained to call during more lucrative call windows.
Percent of Dials to Connection
Key Question it Answers: How efficient are reps at reaching prospects?
What it Measures: The percentage of dials that result in a prospect picking up the phone.
Value: You may have reps on your team that are dialing leads like crazy but not actually connecting with prospects. There may be reps that are dialing less but are simply more efficient at connecting with customers. Time of day, voicemail skills and a rep’s dialing technology can all play a role in how many dials actually result in prospects picking up the phone.
Contact Data Accuracy by List
Key Question it Answers: How accurate is the contact data on a lead list?
What it Measures: Percentage of leads on a list that have accurate contact information (phone/email).
Value: When purchasing lists, it’s important to track how accurate the data is. If you are buying lead lists from suppliers that have too many leads with inaccurate data it is likely time to find another source to buy lead lists from. Track the percentage of leads that have inaccurate phone numbers and/or email addresses that bounce. For example, you can do this by having reps log a call outcome (also known as a call disposition) following calls, and then run a report for dispositions such as “wrong number.”
Calls to Appointment Ratio
Key Question it Answers: How efficient are reps at reaching prospects?
What it Measures: The percentage of dials that result in a prospect picking up the phone.
Value: Sales organizations that put a lot of emphasis on calls need to know which reps are best at booking meetings and which need work. If you have reps that are connecting with a lot of leads but not booking enough meetings, it’s important to drill down and listen to call recordings in order to identify ways that those reps can improve their pitch.
Dials to Deal Ratio
Key Question it Answers: How many dials does your team need to make to close its target deal number?
What it Measures: The total number of dials divided by the number of deals that close as a result of those dials.
Value: This is a vital metric that shows the correlation between your reps’ calling activities and deals that actually close. It lets you gain a powerful birds-eye-view of how reps’ activities are impacting your bottom line. By tracking this metric, you can predict how many SDRs and account executives you need to hire as you build out your sales team.
Sales Sequence Email Open Rate/CTR
Key Question it Answers: Which email messages are prospects opening and which clicking on?
What it Measures: The effectiveness of sales messaging.
Value: When you’re sending sales sequence emails, whether they’re automated templates or personalized emails sent manually, it’s important to measure whether prospects are opening those emails. If links (to content, forms, etc.) are included in emails, it’s likewise helpful to measure whether prospects are clicking on those links.
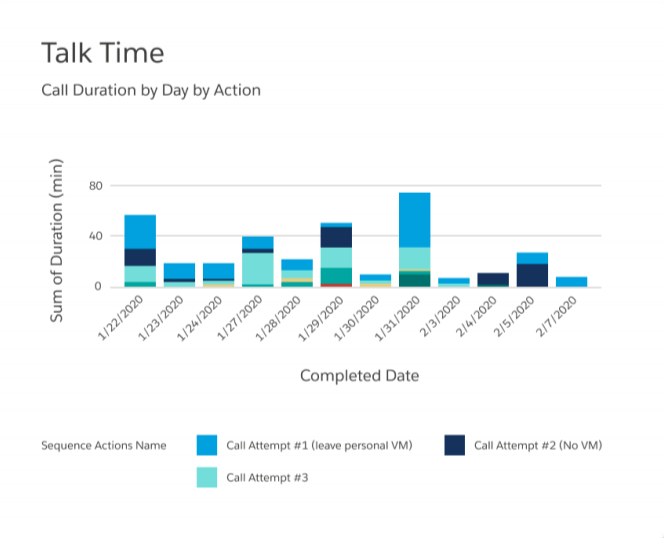 Talk Time
Key Question it Answers: How much time is each rep spending actually talking to prospects?
What it Measures: The total amount of time in a given period (e.g. week, month, quarter) that each rep actually spends talking to prospects. This metric should exclude the amount of time that reps spend on hold, as well as dialing time and time spent leaving voicemails
Value: While activity metrics aren’t the be-all-end-all in sales prospecting, it’s important for sales managers to know how much time reps are actually having conversations. If, for example, a rep is spending a lot of time talking to prospects but is not creating a lot of opportunities or revenue, it can indicate that this rep isn’t efficiently qualifying leads and closing business. This can be a red flag that the rep needs additional sales coaching. Conversely, if an unsuccessful rep isn’t spending a lot of time talking to prospects it could indicate that they need additional coaching or sales tools to help them get on the phone with prospects more often.
Inbound Sales Metrics and KPIs
Many companies agree that there hottest and most sales-ready leads are those that come in through inbound sources like web forms, chatbots, and ads. Whether you have a dedicated team tasked with inbound lead response, or blended reps that handle outbound and inbound sales, tracking the right sales metrics and KPIs can help managers assure that reps are following up with leads fast enough. After all, by even waiting minutes to follow up with a hot lead, it gives them time to move from your site to the competition.
Looking to optimize inbound sales? Make sure you’re tracking these sales metrics.
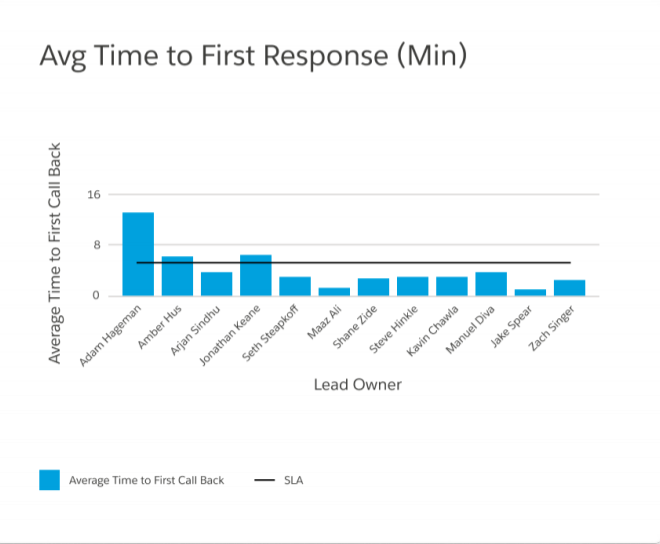 Time to First Response
Key Question it Answers: How long does it take sales reps to respond to inbound sales?
What it Measures: The time elapsed between an important lead behavior (such as filling out a web contact form) and the moment a sales rep emails or calls them.
Value: When inbound leads submit forms on your website, download content, or ask questions, it’s important to get back to them as quickly as possible. According to research from MIT, you’re 100 times more likely to connect with a lead if you call them back within five minutes than if you wait just 30 minutes. Measuring how long it’s taking reps to respond to leads enables managers to ensure that hot leads are getting the attention they need.
Follow-Up Rate
Key Question it Answers: How often are reps following up with leads?
What it Measures: The percentage of leads with calls or emails logged against them.
Value: Many sales reps fail to follow up with reps a second time. But in B2B sales it can take six, eight or even more contact attempts to secure a meeting. It’s important to gauge whether reps are doing their due diligence and following up with leads enough times before moving on.
Hold Time
Key Question it Answers: Are inbound callers spending too much time on hold?
What it Measures: The time that prospects are kept on hold before talking to a rep.
Value: When prospects reach out to sales, it often indicates that they are ready to have a serious conversation. But if callers have to spend too long waiting on hold before talking to a rep, it can lead to frustration. The longer prospects wait on hold, the more likely they are to abandon the call. Reducing hold time can have a dramatic effect on the revenue your team closes from inbound calls.
Abandonment Rate
Key Question it Answers: Are you losing out on valuable inbound phone leads?
What it Measures: The percentage of inbound callers that hang up before a rep can answer the call.
Value: Inbound phone leads are incredibly valuable. It’s important to ensure that these high-value leads aren’t left hanging. If a call abandonment rate is high, it can indicate that you need to hire more reps to cover the phones. It can also indicate that calls are being routed to the wrong place, or that reps are simply failing to answer the phone. Try to make your abandonment rate as close to 0% as possible.
Average Lead Response Time by Rep
Key Question it Answers: Which reps are responding to leads fastest?
What it Measures: This metric reveals which reps have the fastest average response time. It is often viewed as a dashboard with an aggregate view of reps’ average lead response time.
Value: For inbound sales teams, there is often a direct correlation between lead response time and quota. When managing an inbound sales team it’s important to keep close tabs on how quickly each rep follows up with inbound leads. If a particular rep isn’t following up with leads quickly enough, intervene fast. Even waiting 30 minutes to follow up with hot inbound leads can have a catastrophic effect on inbound sales ROI.
Inbound Web Leads by Product
Key Question it Answers: How many leads are interested in a particular offering?
What it Measures: The total number of web leads generated by campaigns related to a particular product.
Value: Leads by campaign is traditionally a marketing metric. But many companies that sell multiple offerings hire product specialists (i.e. salespeople that focus on selling a particular product). Since lead response time is critical, tracking inbound web leads by product can help sales managers determine how many specialists are needed to successfully sell each product.
Opportunities by Lead Team Response
Key Question it Answers: How does lead response time affect opportunities?
What it Measures: How long it takes reps to respond to inbound leads that become opportunities.
Value: It’s important to know how lead response time affects your overall sales pipeline. Knowing how fast reps should respond to leads in order to create opportunities can help you improve overall pipeline health. It can also help sales leaders identify when deals are getting stuck because reps aren’t responding to inbound leads fast enough.
Conversion Rate by Lead Response Time
Key Question it Answers: How does lead response time affect conversions?
What it Measures: This is a report that separates leads that convert into the time that it took reps to initially respond to the lead.
Value: Companies with inbound sales teams often have service-level agreements (SLAs) for how fast reps are supposed to respond to leads. Viewing conversions by lead response time not only helps sales leaders build a case for inbound lead response SLAs, it helps them determine exactly how fast reps need to be getting back to leads. As an example, you might notice that conversions rapidly drop when reps take longer than an hour to get back to leads.
Sales Metrics and KPIs for Measuring Opportunities and Revenue
Many companies have dedicated account executives (AEs) that are laser focused on closing deals with prequalified leads. To gain insight into how effective AEs are, it’s important to gain granular insight into how their activities impact opportunities and revenue. Fortunately, tools like Salesforce make it easy to gain deep insight into opportunity pipeline. And tools like Revenue.io can offer further insight into exactly how AEs activities are working opportunities and closing deals, offering insight
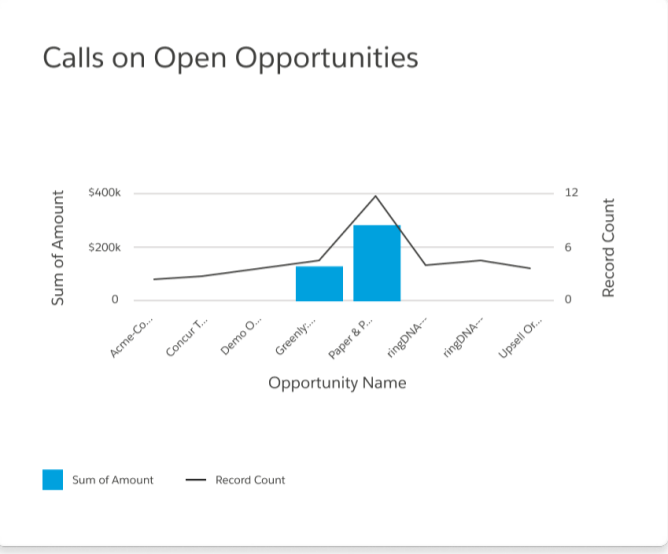 Calls per Opportunity
Key Question it Answers: Are account executives making enough calls to drive opportunities past the finish line
What it Measures: How many calls account executives are account executives making per opportunity?
Value: Sometimes, deals get stuck and take a long time to close. It’s important to ensure that account executives are reaching out to open opportunities often enough to move deals forward.
Average Opportunity Age
Key Question it Answers: What percentage of your open opportunities are still viable?
What it Measures: The average number of days that your opportunities have been open.
Value: B2B deals can take time to close. However, a common problem that some sales teams encounter is that reps aren’t meeting quota because they are working opportunities that are too old and have gone stale.
Average Deal Size
Key Question it Answers: What is the average size of a closed deal?
What it Measures: The average price of your closed deals (can be calculated by product or as an overall average of all products).
Value: This metric helps managers make revenue predictions. If you estimate that a certain number of deals will close each month, the average deal size can help you predict how much revenue will close. When analyzed by deal type, it can also help you identify which kinds of deals your sales team should target.
Pipeline Value
Key Question it Answers: What percentage of your open opportunities are still viable?
What it Measures: The total amount of revenue if every opportunity were to close.
Value: It’s essential for managers to know how much revenue could potentially close (known as pipeline value). Comparing total opportunity revenue with the actual amount that closes can enable you to make more accurate predictions going forward.
Win Rate
Key Question it Answers: How often is your sales team winning deals?
What it Measures: The percentage of opportunities that are won by your sales team.
Value: This is one of the most basic and most crucial metrics to track. Simply put: how effective is a rep at selling your product? If a rep isn’t winning enough deals, it could indicate that they need additional training, that there isn’t sufficient demand for your product or that your expectations need to be re-assessed. According to data from Implisit, a benchmark for B2B sales teams is an opportunity win rate of 6%.
Average Sales Cycle Length
Key Question it Answers: How long does it take sales reps to close deals?
What it Measures: The average time it takes to close the deals you win. This is calculated from the time a lead is created until it is closed/won.
Value: The length of a sales cycle tells managers the end-to-end amount of time it takes deals to close. This is a great metric for managers to not only gauge reps’ efficacy, but also their own. By reducing sales cycle length (through technology and effective coaching) managers can concurrently increase revenue and reduce time-to-quota.
Won/Loss Ratio
Key Question it Answers: How many of your opportunities actually close?
What it Measures: How many opportunities are being won vs lost over a specified period of time (weekly/monthly/quarterly/etc).
Value: Tracking wins against losses over time is important for two main reasons. First, it enables you to gauge whether your sales team’s performance is improving. Secondly, it enables you to spot potential yearly trends. As an example, you might notice that not a lot of deals closed in December when November and January were both strong months. This could indicate that December isn’t the best month for closing deals (as is the case in many B2B industries). You could therefore adjust your revenue predictions accordingly.
Customer Lifetime Value (CLV)
Key Question it Answers: How much revenue do you earn from your average customer?
What it Measures: The average total revenue that is won form new accounts.
Value: It’s important to be able to predict how much revenue can be earned from each customer. You can do this by tabulating the historical lifetime values of your customers. Multiply your average customer lifetime by the average monthly revenue per customer. As an example, if you have 10 customers for an average of 36 months each, and those customers pay an average of $1,000 in revenue per month, then your customer lifetime value is $36,000.
Customer Acquisition Cost (CAC)
Key Question it Answers: How much is the company spending on sales and marketing to secure a typical customer?
What it Measures: The sales and marketing cost required to secure an average customer.
Value: Companies need to track how much it actually costs to acquire a customer. CAC typically includes the sales and marketing costs it takes to secure an average customer. Lowering CAC can correlate with increases in net revenue. But remember that achieving growth often requires expending resources, so simply reducing CAC isn’t always best way to grow revenue.
Revenue from Calls per Source
Key Question it Answers: Which marketing efforts are driving the most valuable calls?
What it Measures: The total revenue closed originating from calls driven by a marketing source (channel, campaign, ad group or keyword).
Value: To make the best marketing investments possible, it’s vital to track revenue from leads that convert online and also revenue from leads that convert over the telephone. This is possible with a call tracking tool that integrates with your customer relationship management (CRM), where your revenue data is stored. A revenue-based call tracking tool can report which channels, campaigns, ad group and even keywords are driving calls that result in the most revenue.
Conversation Etiquette Metrics and KPIs for Sales
An exciting new frontier in sales analytics is using artificial intelligence based tools to track conversation etiquette metrics. Tools like Revenue.io’s ConversationAI empower sales managers to track whether reps are talking too much or not enough. It also helps managers assess whether reps need to be coached to be better listeners.
Percent Talk Time
Key Question it Answers: Are reps talking enough or too much?
What it Measures: The percentage of a call that a rep is talking. This can be viewed for a single call or in aggregate across multiple calls.
Value: Are your most successful reps the ones that are taking charge of the conversation and talking a lot, as advised by certain sales methodologies like The Challenger Sale? Or are your reps who are booking the most demos and closing the most deals the ones that are the best listeners? Tracking talk time percentages can help you answer the important question: how often should reps be talking?
Overtalk Ratio
Key Question it Answers: Are reps good listeners?
What it Measures: How often reps are talking at the same time as prospects.
Value: One of the most important sales metrics for measuring conversation etiquette is overtalk ratio. Tools like Revenue.io’s ConversationAI make it easy to measure how often reps are talking at the same time as prospects. Talking over prospects is rarely a good tactic, as it can make prospects feel like they’re not being listened to. If a certain rep has a high overtalk ratio, then they are likely in need of coaching to be better listeners.
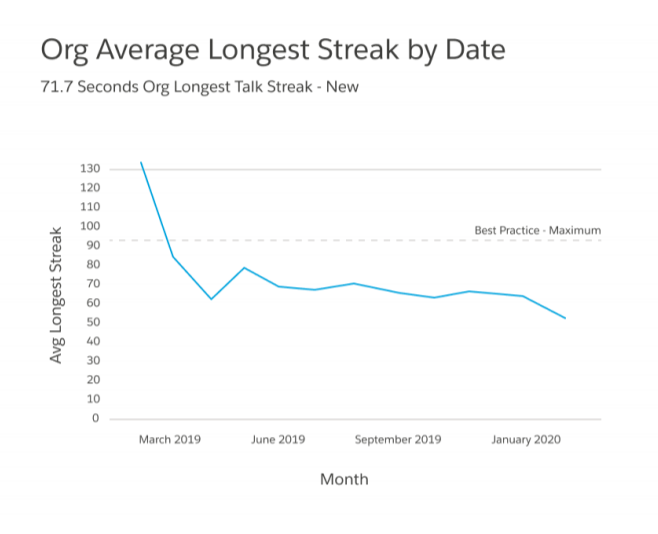 Average Talk Streak
Key Question it Answers: Are reps asking enough questions?
What it Measures: How long reps talk on average without being interrupted.
Value: Most great salespeople realize that sales conversations need to be just that: conversations. Measuring average talk streaks can help determine if reps are taking enough time to ask prospects questions, listen from them and learn from them. Or if they are simply launching into a long sales pitch.


